Azulens Blog
4 Mistakes When Using LLMs to Analyze Ad Data via MCP
MCP connectors can give LLMs direct access to live advertising data across dozens of platforms. But easier access does not automatically produce reliable analysis. The biggest risks appear when marketers ask for entire analyses in one prompt, lead the model toward a predetermined conclusion, fail to validate cross-channel calculations, or confuse attributed performance with causal impact. The solution is not better prompting alone. It is a controlled analytical process in which retrieval, normalization, validation, interpretation, and causal inference remain separate steps.
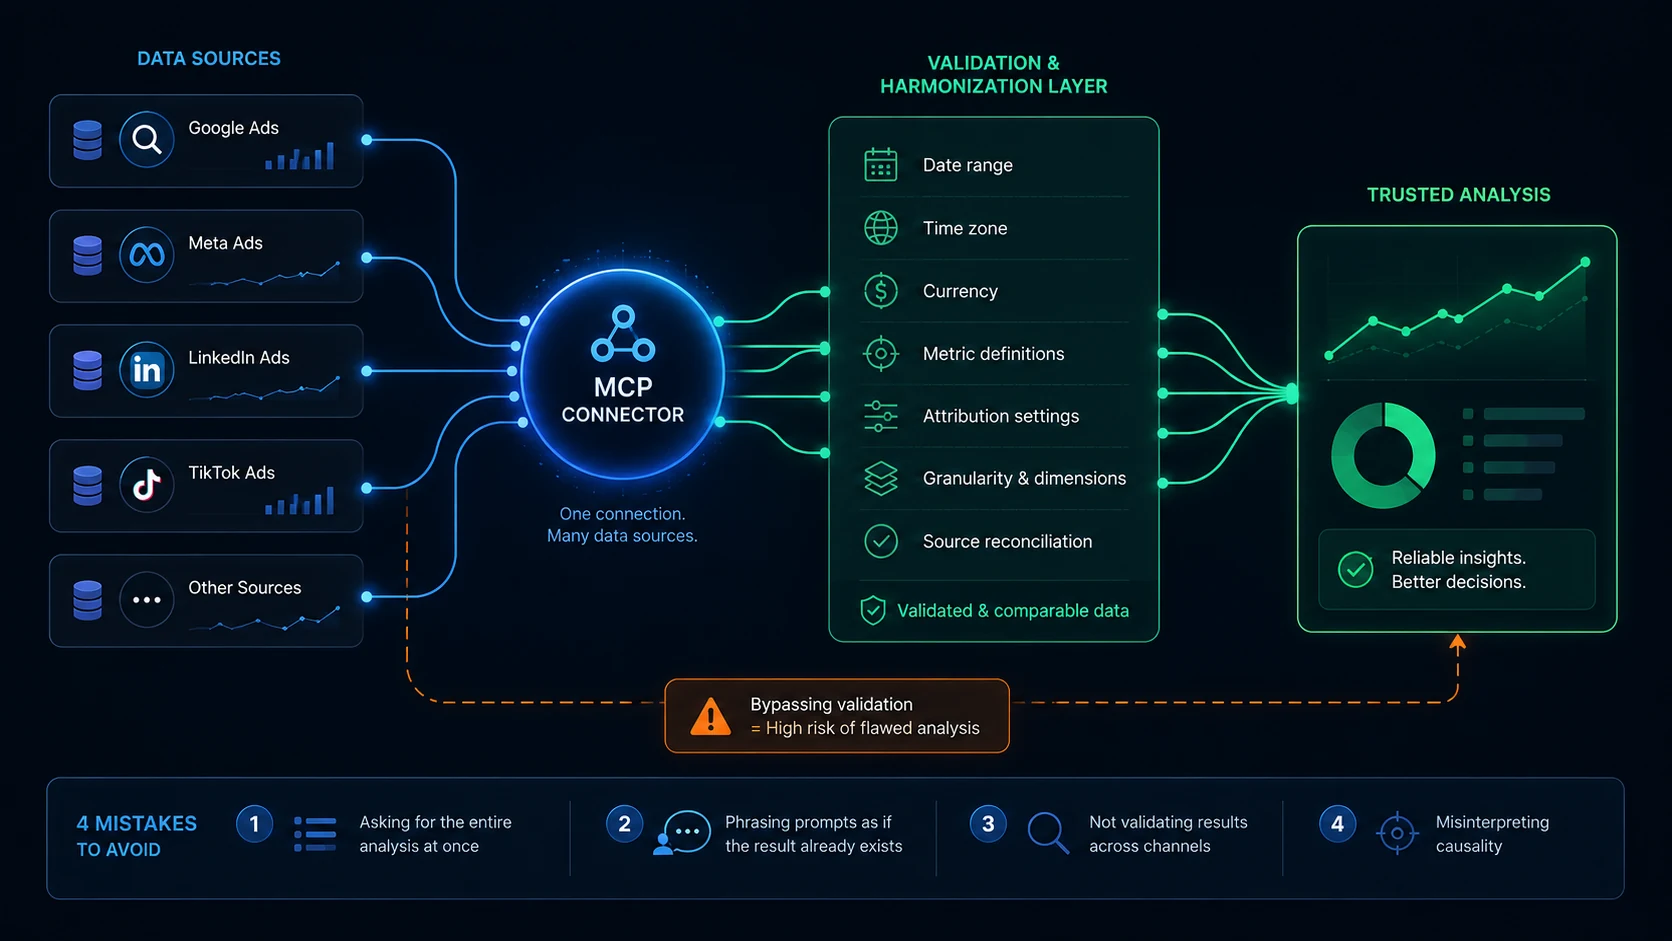
Connecting an LLM to advertising data feels like a major leap forward.
Instead of opening Google Ads, Meta Ads, LinkedIn Ads, TikTok Ads, analytics tools, and spreadsheets separately, you can increasingly expose those data sources to an AI assistant through Model Context Protocol, or MCP.
Supermetrics, for example, currently exposes more than 170 data sources through its MCP server. From the user's perspective, that can look like one interface to the entire marketing stack.
But there is an important distinction:
One connection to your data is not the same thing as one validated analytical dataset.
MCP standardizes how applications can expose tools and data capabilities to AI systems. It does not define how metrics should be harmonized, which comparison is statistically meaningful, whether two platforms measure the same thing, or whether an observed relationship is causal.
That analytical layer still has to be designed.
And this is where I see four particularly dangerous mistakes.
Mistake 1: Asking for the entire analysis in one prompt
A prompt like this sounds efficient:
Analyze our performance across Google Ads, Meta, and LinkedIn for the last quarter. Identify what changed, explain why ROAS declined, determine which channels are underperforming, and recommend how we should reallocate budget.
The problem is not that an LLM is incapable of doing those things.
The problem is that this prompt hides a long sequence of decisions.
Before any recommendation can be trusted, somebody has to determine:
- Which accounts belong in the analysis?
- Which dates are being compared?
- Which metrics should be requested from each source?
- Are the currencies identical?
- Are account time zones aligned?
- Are conversion definitions comparable?
- Are attribution settings comparable?
- At what level should the data be aggregated?
- Are changes large relative to normal volatility?
- Is the analysis descriptive, predictive, or causal?
When all of this is delegated in one instruction, the final answer may sound coherent while making it extremely difficult to see where an error entered the process.
Supermetrics for instance itself recommends specifying the date range, metrics, and dimensions in data prompts. For a series of tasks, its documentation explicitly recommends breaking the work into smaller steps.
That is exactly how I think MCP-based analysis should be approached.
A safer workflow might begin with:
List the data sources and accounts you would need to answer this question.

Do not analyze performance yet.
Then:
For Google Ads only, retrieve daily spend, impressions, clicks,
conversions and conversion value for January through March.

Show the fields you selected and the account scope.
Do not interpret the results yet.
Then repeat the retrieval and validation process for the other sources.
Only after the data has been checked should the model be asked to analyze it.
This may feel slower than asking one giant question.
It is usually much faster than discovering later that a polished executive summary was built on the wrong conversion field.
The principle is simple:
First make the process observable. Then make it intelligent.
Mistake 2: Phrasing the prompt as if the conclusion already exists
Consider the difference between these questions:
Why did our Meta campaigns become less efficient last month?
and:
Determine whether our Meta campaigns became less efficient last month.

Define the efficiency metric you are using, quantify the change,
compare it with the previous period and normal historical variation,
and only then investigate possible explanations.
The first prompt contains a premise: performance became less efficient.
The LLM's job appears to be finding an explanation for something the user has already declared to be true.
That is risky.
Research on LLM sycophancy has shown that models can sometimes favor answers that align with users' stated beliefs instead of challenging those beliefs. This does not mean an LLM will automatically accept every false premise. But it is a good reason not to frame analytical questions as conclusions.
The same problem becomes more serious with prompts such as:
Why is TikTok driving our decline in ROAS?
Now two things have already been assumed:
- ROAS has meaningfully declined.
- TikTok caused the decline.
Neither may have been established.
A much stronger analytical prompt is:
First verify whether total ROAS declined.

If it did, decompose the change by channel and identify which changes
mathematically contributed most to the overall movement.

Separate observed facts from hypotheses about why those changes occurred.

Do not infer causality from temporal relationships alone.
The distinction between finding evidence and finding an explanation for something presumed to be true is crucial.
Good analytical prompting should give the model permission to answer:
The premise is not supported by the data.
Mistake 3: Trusting cross-channel results without validating the underlying queries
This may be the most important MCP-specific problem.
MCP servers are presented as one connection through which an AI application can access many marketing data sources.
That does not mean Google Ads, Meta Ads, LinkedIn Ads, and other platforms suddenly become one homogeneous dataset.
The documented Supermetrics MCP query operation requires a data-source identifier, or ds_id, for a data query.
In practical terms, if an agent is querying the raw Google Ads source and the raw Facebook Ads source, those are separate source-specific queries.
There is an important exception: Data Blending. A previously configured blend can itself be queried as a data source. So it would be inaccurate to claim that every cross-channel question necessarily produces exactly one platform call per channel.
The bigger point remains:
The apparent simplicity of the conversation can hide a much more complicated data-retrieval and reconciliation process underneath.
Cross-platform data is particularly sensitive because fields that sound equivalent are not automatically equivalent.
A spend field can have different names across advertising sources. You need to have mapping functionality precisely because source schemas differ.
The risks go beyond names.
Two sources may differ in:
- attribution windows
- click versus view-through attribution
- conversion definitions
- currencies
- account time zones
- campaign naming conventions
- aggregation level
- available dimensions
- delayed conversion reporting
- treatment of missing values
Even a technically correct addition can therefore produce a conceptually incorrect KPI.
Imagine an LLM retrieves $100,000 of conversion value from one platform and $80,000 from another and reports:
Total cross-channel conversion value: $180,000
The arithmetic may be perfect.
But was the same customer counted twice?
Were both figures using the same attribution window?
Was one platform reporting attributed revenue while another used website analytics?
Were both accounts using USD?
The final number cannot answer those questions.
This is why validation has to be a separate stage.
Providers of MCP servers often recommend querying the underlying data sources separately and comparing them with the blended result when troubleshooting joins.
I would apply an equivalent principle to LLM-based analysis even when no formal blend has been configured.
Before trusting a cross-channel result, validate:
- The account scope for every source.
- The exact date range.
- The time zone.
- Currency consistency.
- The exact metric definition in every platform.
- Attribution settings where relevant.
- The requested dimensions and resulting granularity.
- Source-level totals against the native platform or an established report.
- Any calculations created after retrieval.
- The final combined result against the validated source totals.
For calculated KPIs, I would also prefer retrieving their components where possible.
For example, instead of accepting only a returned ROAS value, retrieve spend and conversion value and independently recompute:
ROAS = conversion value / spend
That gives you another validation point.
The same applies to CPA, CTR, CPC, conversion rate, and other ratio metrics.
The goal is not to distrust the LLM.
The goal is to make errors detectable.
Mistake 4: Treating attributed performance as causal evidence
This mistake existed long before MCP.
LLMs simply make it easier to turn it into a confident narrative.
Imagine the data shows:
- You increased Meta spend.
- Total revenue subsequently increased.
- Meta reports more attributed conversions.
It is tempting to ask:
How much revenue did the additional Meta spend generate?
But ordinary platform reporting cannot necessarily answer that question.
Attribution asks which conversions should receive credit according to a defined attribution system.
Causality asks what would have happened without the advertising.
Those are different questions.
Google makes this distinction explicitly in its Conversion Lift documentation.
Standard attributed conversions are counted according to conversion tracking settings and attribution rules. Conversion Lift instead uses a treatment and control framework to estimate incremental conversions that would not have happened without the ads.
That is the causal question.
An LLM cannot create the missing counterfactual simply because it has access to more data.
It can identify patterns.
It can calculate correlations.
It can decompose changes.
It can propose hypotheses.
It can help design an experiment.
But if the underlying data does not identify a causal effect, a fluent explanation does not make the effect causal.
Statements such as:
Increasing Google Ads spend caused revenue to rise.
should therefore require substantially stronger evidence than:
Google Ads spend and revenue both increased during the period.
Or:
Google Ads accounted for the largest increase in platform-attributed
conversion value during the period.
If the business question is causal, the measurement design has to support causal inference.
Depending on the situation, that might involve controlled lift experiments, geo holdouts, user-level holdouts, or other causal measurement approaches with clearly stated assumptions.
The important part is not which methodology you choose.
It is recognizing when ordinary reporting has reached its analytical limit.
A safer process for analyzing ad data through MCP
I don't think the answer is to avoid MCP-based analysis.
The opposite.
The access layer is extremely useful.
But I would put a controlled workflow around it.
Step 1: Define the question
Start with the business question, without embedding the expected answer.
Determine whether acquisition efficiency changed materially last month
and identify where the change came from.
Step 2: Define the measurement
Before pulling data, establish:
- KPI definitions
- comparison period
- source accounts
- required dimensions
- currency
- time zone
- attribution settings
- required level of granularity
Step 3: Retrieve source data
Query each required source deliberately, or query a documented and validated blend.
Do not jump straight from retrieval to recommendation.
Step 4: Validate
Compare source-level totals with known reports or native platform reporting.
Check that the model used the fields you expected.
If the interface exposes tool calls, inspect them.
Step 5: Harmonize
Only combine metrics once you have established that they are genuinely comparable.
Where definitions differ, preserve the distinction instead of forcing them into one KPI.
Step 6: Analyze
Now ask the LLM to identify patterns, decompose changes, find anomalies, and formulate hypotheses.
Ask it to explicitly distinguish:
- observations
- calculations
- assumptions
- hypotheses
- unsupported conclusions
Step 7: Establish the causal boundary
Finally ask:
Which conclusions are descriptive and which, if any, can be interpreted
causally from the available measurement design?
That one question can prevent a surprising number of bad recommendations.
MCP removes data friction. It does not remove analytical responsibility.
This is the part of MCP-based advertising analysis that I think is easy to underestimate.
The biggest future risk may not be an LLM inventing a number from nowhere.
With live data connectors, the numbers can be completely real.
The more subtle problem is that real numbers can be selected incorrectly, combined incorrectly, compared incorrectly, or interpreted incorrectly — and then explained in language that sounds completely convincing.
That makes process design more important, not less.
A reliable AI analytics workflow therefore needs more than access to the right data.
It needs explicit retrieval steps, metric definitions, reconciliation, statistical judgment, validation, and a clear boundary between attribution and causality.
MCP can make the data accessible.
You still have to make the analysis trustworthy.
Sources and verification
- Model Context Protocol, Architecture and Tools documentation. MCP uses a host-client-server architecture in which servers expose callable tools to AI applications.
- Supermetrics, Supermetrics MCP server, published August 27, 2026. Documents one MCP connection providing access to many Supermetrics data sources.
- Microsoft Learn, SuperMCP (Preview). Documents the Supermetrics MCP
data_queryoperation and its requiredds_id. - Supermetrics, Use cases for Supermetrics AI chats and Supermetrics MCP server. Recommends specifying dates, metrics, and dimensions and breaking complex series of tasks into smaller steps.
- Supermetrics, About Data blending. Documents differences between source fields and the need for cross-source field mapping.
- Supermetrics, About joins in data blending. Recommends querying source data separately and comparing it with the final blended result.
- Google Ads Help, Understand your Conversion Lift based on users measurement data. Explicitly distinguishes standard attributed conversions from incremental conversions measuring causal impact.
- Sharma et al., Towards Understanding Sycophancy in Language Models, ICLR 2024. Finds that AI assistants can sometimes favor responses matching user beliefs over truthful responses.